Easy and Extensive Resource Monitoring with Netdata
When running analyses in the cloud, it's essential that you can monitor your resource usage. Understanding your compute usage is crucial in ensuring your analyses are running as efficiently as possible and making the most of your valuable cloud dollars.

When running analyses in the cloud, it's essential that you can monitor your resource usage. Understanding whether your analyses may be hitting resource limits and may perform better on a bigger machine, or aren't utilising all of the resources available and could be run more cost effectively on a smaller machine, is crucial in ensuring your analyses are running as efficiently as possible and making the most of your valuable cloud dollars.
Simple real-time monitoring tools like htop (which already comes preconfigured on every RONIN machine) are great for sporadically checking resource usage. But what about when you want to get a more detailed overview of the compute resources used throughout an entire analysis?
Well, look no further than Netdata.
What is Netdata?
Netdata collects hundreds of metrics from your machine and displays them in beautiful, interactive, easy-to-interpret graphs:
Installing Netdata
You can now install and connect to Netdata with a single button click in RONIN LINK.
Installing Netdata on your RONIN machine is as easy as entering the following command in your machine terminal and following the prompts:
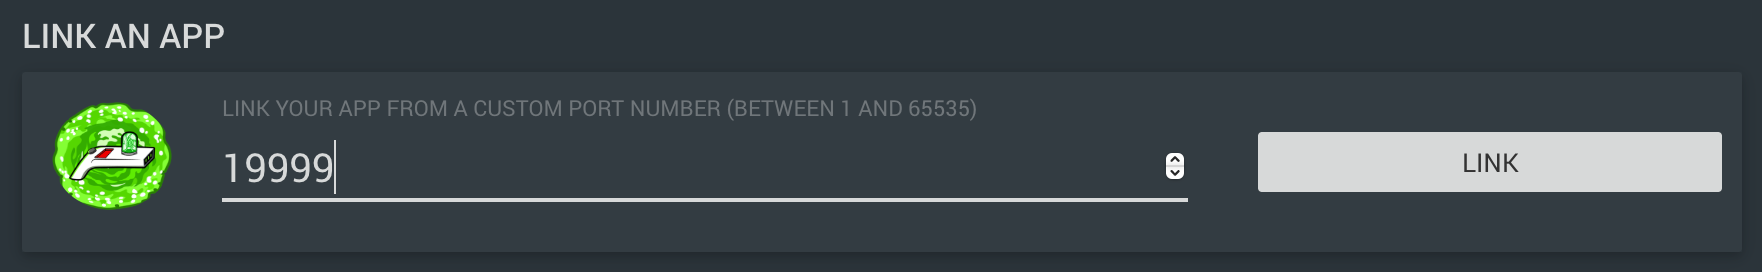
bash <(curl -Ss https://my-netdata.io/kickstart.sh)Then, to connect to Netdata, ensure your machine is open in RONIN LINK, click the "connect to machine" button, enter 19999 in the "link an app" section and click link.
Your fancy new monitoring system should open in a new browser window. Get to know Netdata's dashboard with the following guide: https://learn.netdata.cloud/guides/step-by-step/step-02
Monitoring GPUs
GPU monitoring is not enabled by default in Netdata, but Netdata does provide the option to monitor NVIDIA GPU performance metrics via the nvidia-smi tool. If you are using a GPU instance and would like to enable GPU monitoring in Netdata follow the steps below:
1. Check whether you already have the nvidia-smi tool installed by running the following command on your machine: which nvidia-smi. If there is no result you will need to install the correct NVIDIA driver for your instance type following steps 2-10, otherwise continue to step 11.
The following steps are for Ubuntu operating systems. If you are using a different operating system please refer to the main documentation at: https://docs.nvidia.com/datacenter/tesla/tesla-installation-notes/index.html#package-manager.
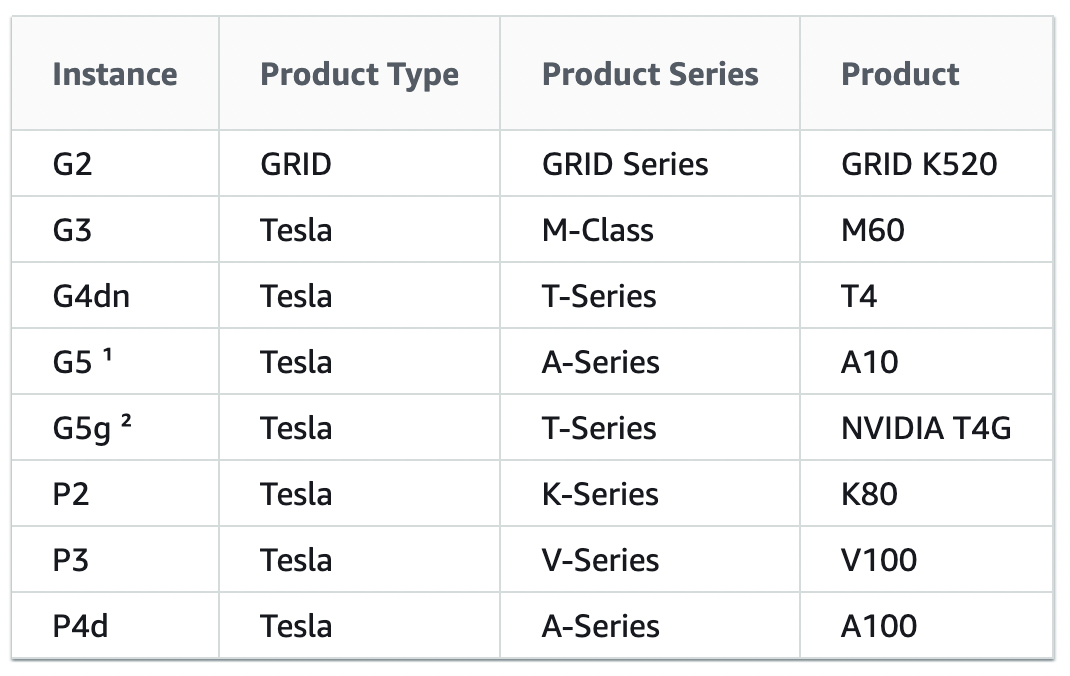
2. Search for the 64-bit NVIDIA driver appropriate for your instance type using this online tool: https://www.nvidia.com/Download/Find.aspx. For Product Type, Product Series, and Product, use the options in the following table, then select the Operating System you chose in Step 1 of your machine creation and we recommend selecting the Recommended/Certified drivers as the final option.
3. Select the correct driver from the search results and copy the version number at the top of the driver information
4. On your machine terminal type the following command replacing the version number with the version number you copied in Step 2: DRIVER_VERSION=450.80.02
5. Update your apt package lists: sudo apt update
6. Install the build-essential tools: sudo apt install -y build-essential
7. Run the following command to install the correct NVIDIA drivers: curl -fSsl -O https://us.download.nvidia.com/tesla/$DRIVER_VERSION/NVIDIA-Linux-x86_64-$DRIVER_VERSION.run
8. Run the installer sudo sh NVIDIA-Linux-x86_64-$DRIVER_VERSION.run
9. Follow the prompts and select the default options on the screen during the installation
10. Confirm the nvidia-smi tool is now available: which nvidia-smi
11. Once the nvidia-smi tool is available, you must enable this plugin in Netdata by editing a Netdata config file: cd /etc/netdata/ && sudo ./edit-config python.d.conf
12. Remove the '#' before nvidia_smi so it reads: nvidia_smi: yes and save the file
13. Restart Netdata: sudo systemctl restart netdata
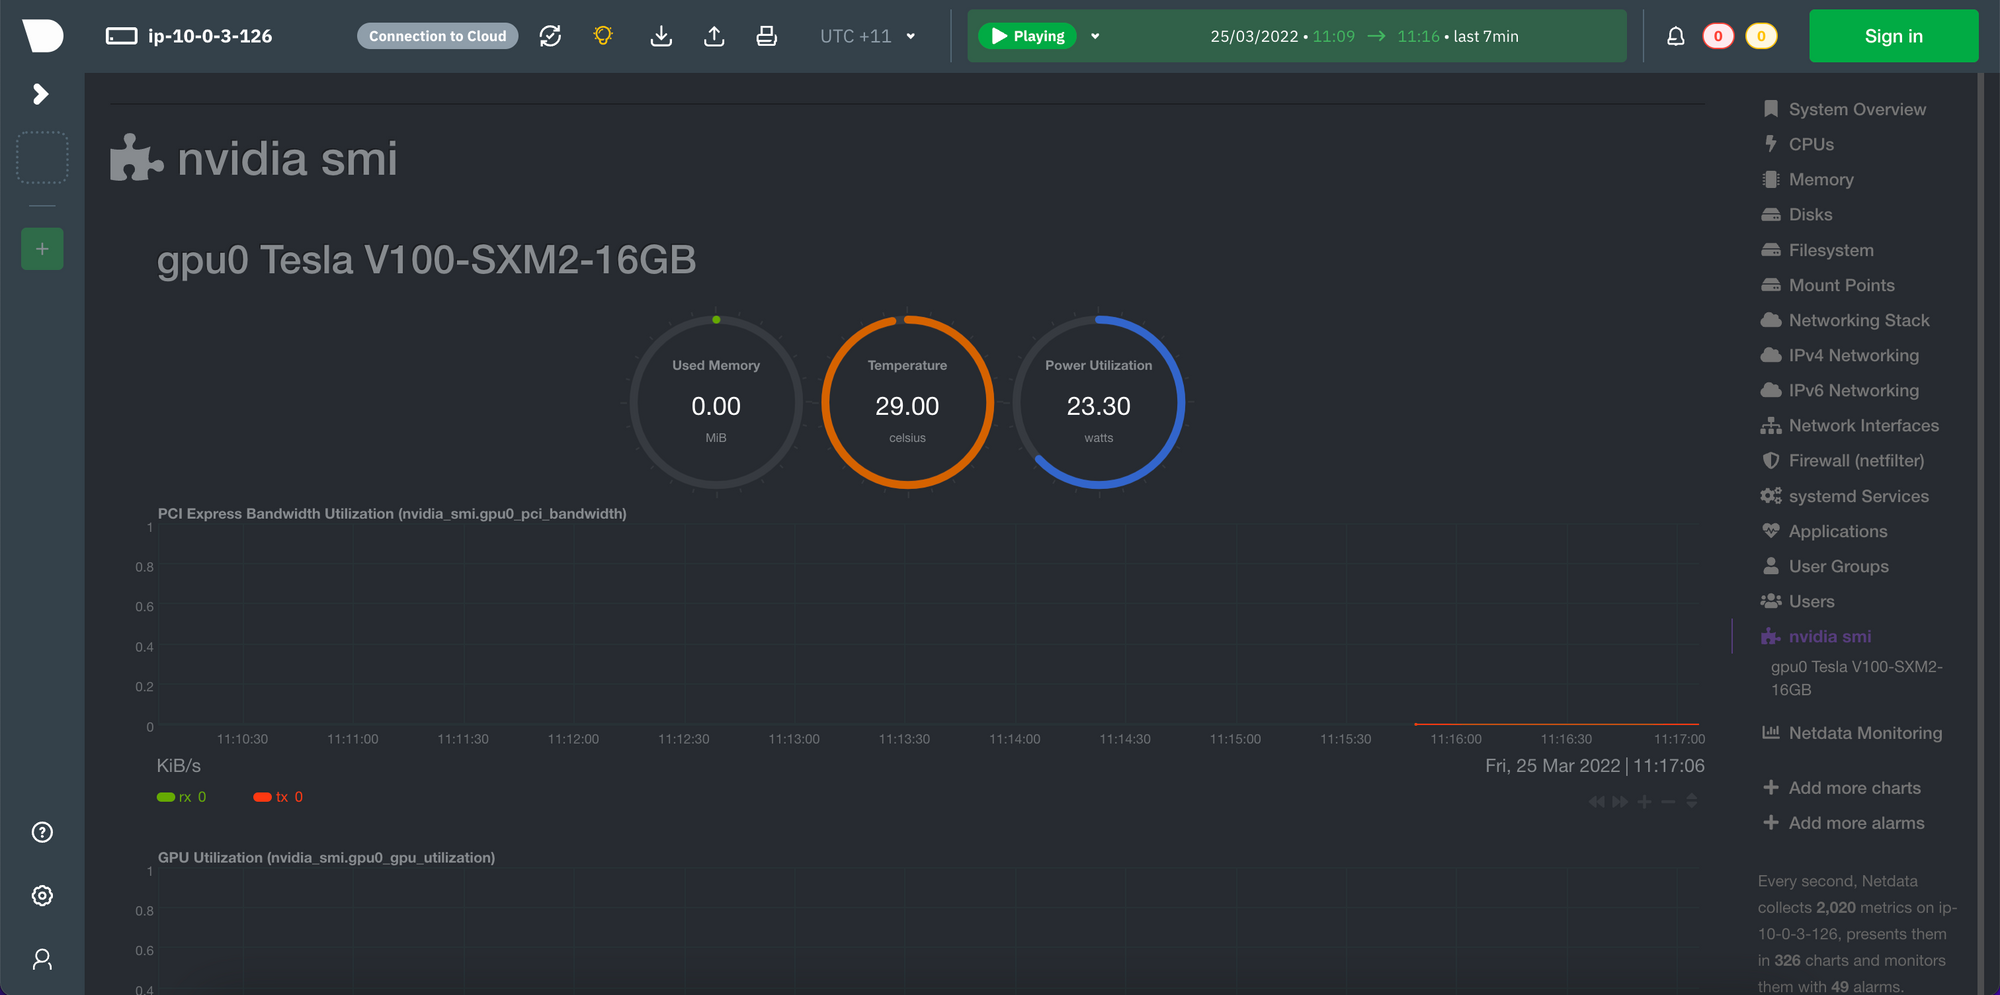
14. Connect to your Netdata dashboard again and you should now see a new menu item in the right menu called "nvidia smi". Click on this link and it will bring up a whole range of charts for monitoring your GPUs.
Now you can stalk your machine to your heart's content!