Viewing RONIN Log Activity With Splunk: Part 1
A universal requirement for compliance is that logs be kept to track certain activities and data access. In this blog post we describe how to use Splunk to examine audit trail logs from RONIN Core.
One of the benefits of RONIN is that it creates a sandboxed environment where researchers can be free to do what they need, but while meeting requirements for security and compliance. A universal requirement for compliance is that logs be kept to track certain activities and data access. In this blog post we describe how to use software for security information and event management (SIEM) to examine audit trail logs from RONIN Core. We illustrate this using Splunk, but describe the concepts at a high level, because you can do this with any SIEM software. This post is part of a two-part series; in the next post we will dig deeper into audit trail logs for RONIN Isolate, our product designed to provide an audit trail for fine-grained data access.
Introducing your logs
A key ingredient to assembling audit trails is combining information from multiple sources. These are the relevant sources.
- RONIN Access Logs. These JSON format logs contain activities logged by the RONIN UI. If you have enabled logging (an option for RONIN Core, selected by default for RONIN Isolate) RONIN Access Logs are located in a bucket prefixed by
s3created by RONIN during installation. These logs are critical to interpreting what has happened because they describe high-level user actions (e.g. logging in, creating resources, deleting volumes, granting access to object storage). In Part 1 of this series, we focus specifically on the contents of these logs, and how to extract relevant information to gain insights into usage. - AWS CloudTrail. These logs are optionally enabled within the AWS account in which RONIN is installed, and can be found by searching for the AWS CloudTrail service. AWS CloudTrail logs record events that occur in an AWS account - so as RONIN orchestrates a sequence of lower level AWS API calls to create machine or cluster, AWS CloudTrail will log information about them. There are two categories of events that are particularly important to RONIN: Management events and Data events. Management events describe actions taken on the resources within your accounts, and are enabled by default. Data events describe actions taken on your S3 buckets, and must be enabled specifically. In RONIN Isolate, data events are used with all other types of logs to provide detailed information about who accessed what objects.
- Amazon CloudWatch. These logs are enabled by default in all RONIN installations to collect some performance statistics from machines created within RONIN. If you are using RONIN Isolate with Amazon Workspaces, you can log Workspace accesses in AWS CloudWatch.
Getting everything together
Now that you know the logs you are after, the next step is to get them into your logging software. In Splunk, the Splunk Add-On for AWS allows you to ingest CloudTrail and CloudWatch logs. Depending on the amount of data you are generating and the performance you need, there are multiple ways to access them e.g. you can read the S3 logs incrementally, or you can configure SNS and SQS services to accept events from CloudTrail so that Splunk can subscribe to the log stream (which will have better performance). Regardless of how you do it, we suggest that you create an AWS IAM role for Splunk with minimum permissions to access the logs.
RONIN access logs can be ingested using the same add-on from a Generic S3 bucket. However, you will need to configure your sourcetype in the appropriate props.conf configuration file (see example lines below) to use the correct timestamp field, and to increase the line length to accommodate the session and server logs embedded in each record.
TRUNCATE = 1000000
INDEXED_EXTRACTIONS = json
TIMESTAMP_FIELDS = ts_created
Who did what and when?
One of the most basic functions of logging is to get an overview of who did what and when. Users are included in the RONIN Access logs and can be found in a Splunk search as follows.
user_id="batman@ronin.cloud"
This will generate the logical series of user interface operations that batman@ronin.cloud has executed within RONIN. Each event has a unique field called error_message which describes the action. Parameters to the action are supplied in JSON string format in the field called error_data. Below is an abbreviated CREATE_MACHINE event; for the expanded version, see the full Audit documentation.
{
  "ts_created": "2022-07-01T14:31:49.822Z",
  "error_code": "ACCESS_LOG",
  "error_message": "CREATE_MACHINE",
  "error_data": "json string here",
  "user_id": "batman+aa@ronin.cloud",
  "session_log": "JSON string here",
  "server_log": "JSON string here"
}
Once you have identified resources that users have created from the error_data(for example, machines, volumes, and object storage access keys) you can dig deeper in to AWS logs to look at everything that has happened to a specific resource.
If you are used to on-premise logs, you may be surprised that you don't automatically see what people are doing on the machines themselves, such as ssh accesses. Because RONIN machines are disposable and we can log activities at the RONIN UI level and at the object storage/AWS infrastructure level, it may not be necessary to have this level of data. However, if you do need it, you can configure every machine in RONIN to push required machine-level logs to CloudWatch, and then to your log analysis software.
Creating dashboards of summary statistics
To dig into specific access trails you will probably want to search on specific resources, keys, time frames or events. But as a first pass you probably want to create some dashboards that allow you oversight at a high level. Here we describe how to generate some "big pictures" of all things RONIN.
Summary statistics from known fields
Suppose we want to create a timeline of actions taken within RONIN. In Splunk, we can create a timeline dashboard and input data with a search string something like this.
source="ronins3logs" host="maincampus" sourcetype="RONIN_json"| timechart count by error_message limit=10
Our source is the S3 log files we have configured to import from their home bucket. We may be operating multiple RONIN installations, so we limit the search to only those from the "maincampus" installation (in contrast to the RONIN that services the medical school). We configured the sourcetype to be RONIN_json to change the line length and timestamp as described above. Finally, we take these results and create a timechart of the count oferror_message events (Figure 1).
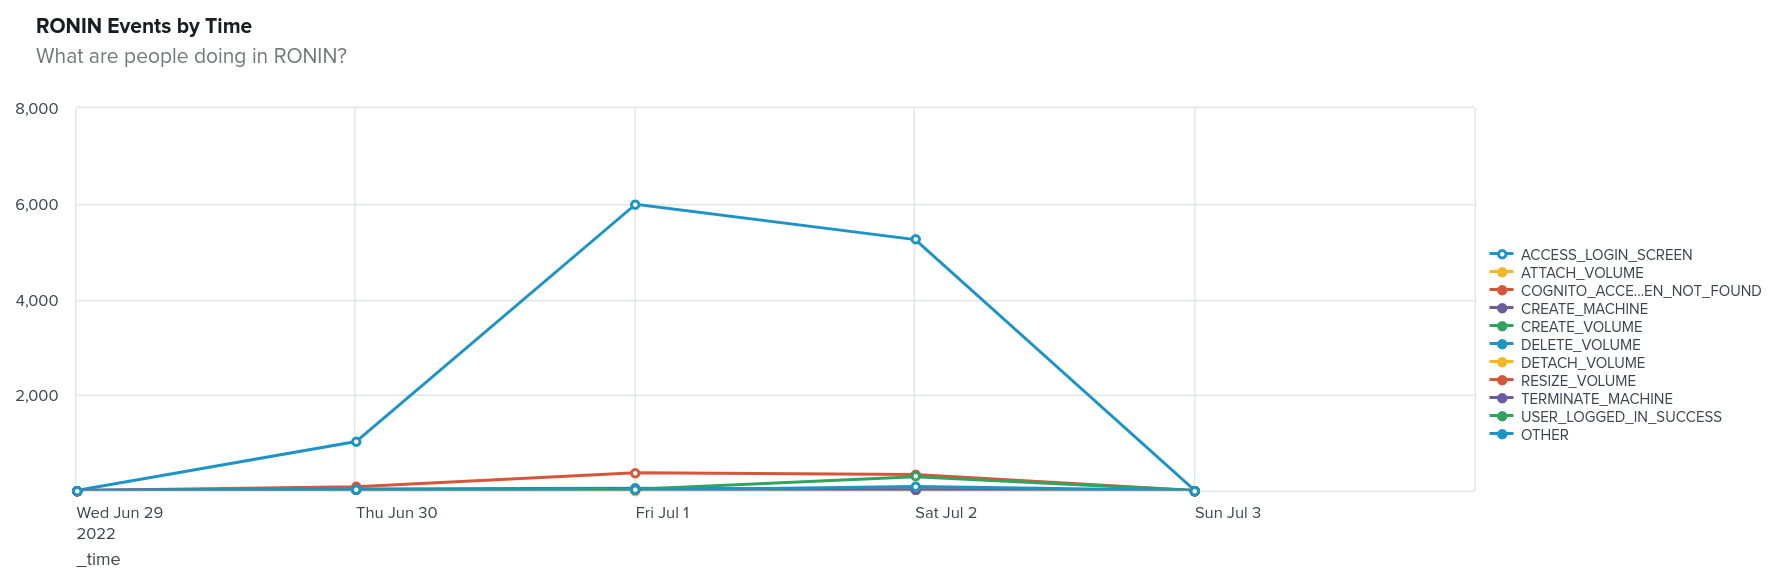
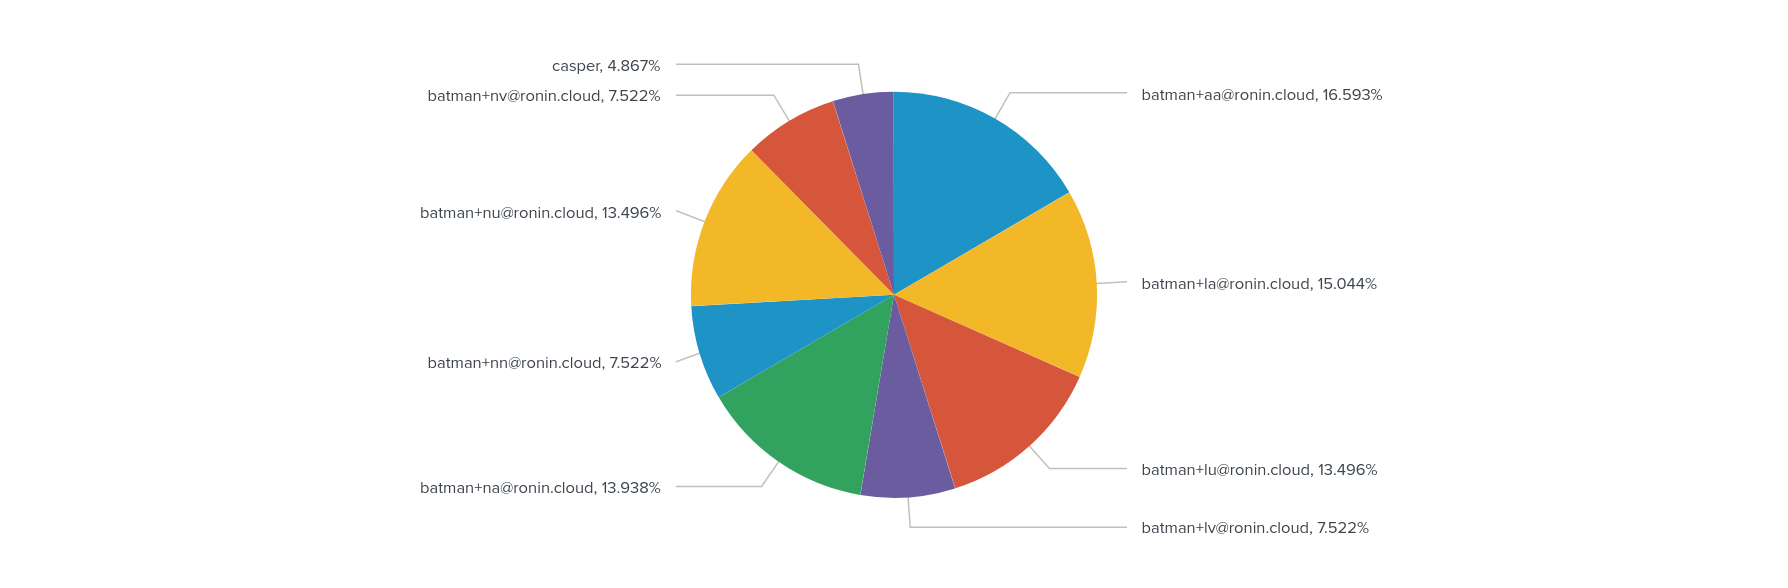
These data come from our test system, which explains the steady stream of logins and the early morning weekend burst of activity. But if you didn't know this, you might be wondering what users were doing this. Let's make a pie chart and grab the user_id fields to investigate.
source="ronins3logs" host="maincampus" sourcetype="RONIN_json"
user_id != NOT_SET
|  stats count by user_id
The initial part of our search is as above, except that we filter by events which have a user_id. For example, there is no user_id available until a user has authenticated. Then, we create a count of events by user_id. The result is shown as a pie chart with percentages in Figure 2.
Extracting and using data from complex fields
RONIN logs include quite a bit of useful information in JSON structures, such as the parameters and outputs associated with an event, the session log (with everything related to your RONIN login) and the server log, a basic dump of the PHP $_SERVER variable, which contains important variables such as the remote IP address of the entity viewing the current page, and the authenticated remote user. If you want to extract these you can do so using Splunk's spath command, which allows you to parse the internal JSON structure.
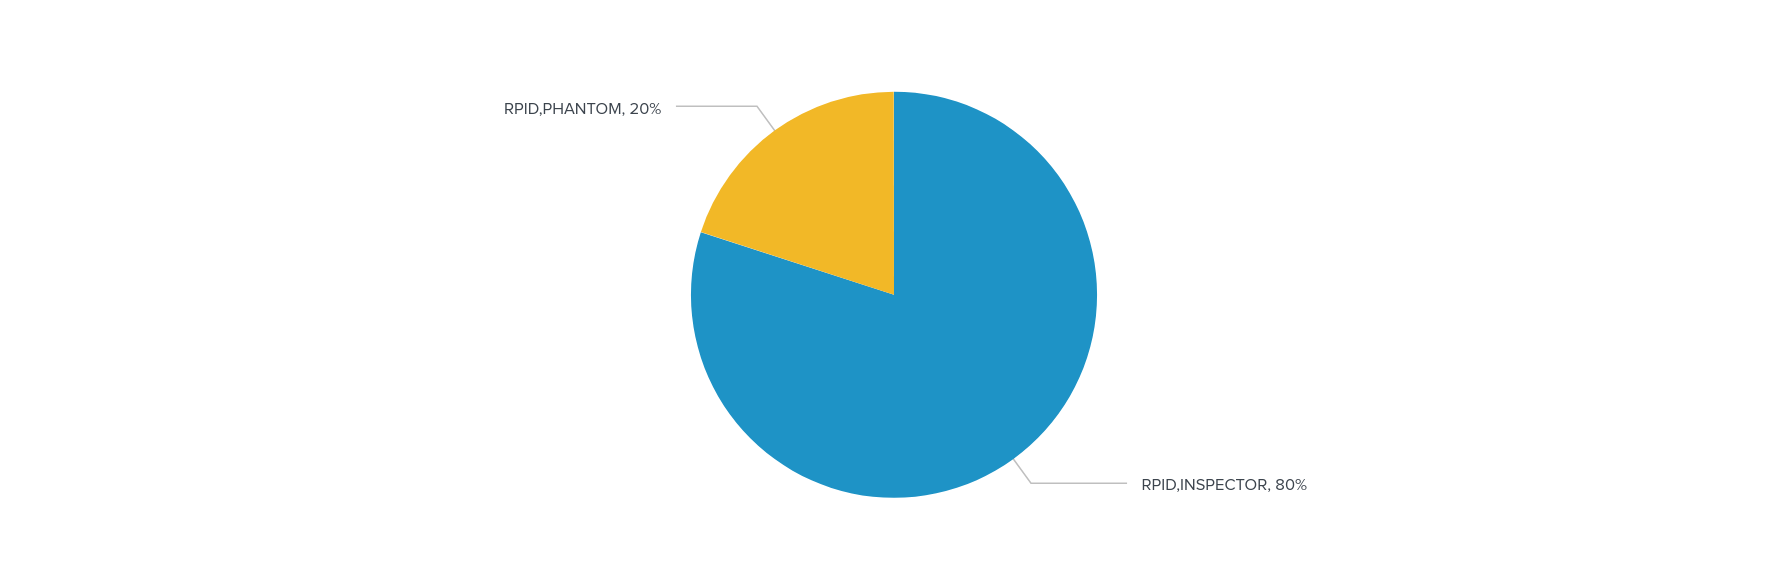
One of the things you might want to do is get into the tags in the error_data field, for example to see what projects are most active.
source="ronins3logs" host="maincampus" sourcetype="RONIN_json" | spath input=error_data | rename Tags{}.Key as tagkey, Tags{}.Value as tagvalue  | eval x=mvzip(tagkey,tagvalue)
| mvexpand x
| search x=RPID*
| stats count by x
Let's break this down. The first part of the search is as above. However, here we want to extract information from the error_data field using spath. Unfortunately, everything is embedded in the Tags array, which has many values, and we only want to count the values where the Tag key is equal to RPID, or the RONIN Project ID.
To do this, we first rename Tags{}.Key and Tags{}.Value for our sanity. Then we create a new variable called x, which is the concatenation of these two keys using the mvzip command. Next, we replicate the events for each distinct value of x, or each key value pair, using mvexpand. This allows us to filter for events where x begins with RPID (in other words, where the Tag key is equal to RPID, our goal). Finally, we create a table counting the events by RPID. In a dashboard pie chart, this looks like Figure 3.
The possibilities are endless
As you can see this is just the beginning. In our next post in this series we will show you how to integrate AWS logs to dive deeper into the audit trail for data access. But in the meantime, we'd love to see what you're doing with your RONIN and AWS logs, or what you'd like to replicate from your old environment. Show us in the Slack channel.